…let’s get to some real weather :)
Real weather
As I pointed out in my 19 Dec 2016 post, the EnergyPlus epw file contains a series of hourly weather observations. For real testing, though, we need real meteorological observations. The NOAA Integrated Surface Data provides the bulk of the observations required (temperature, pressure, wind, cloud cover, precip). Using the template csv file for Boston TMY data and the KBOS ISD data, one can develop a replacement weather dataset.
But, wait! Solar!
Yep. Also, as I noted in my 19 Dec 2016 post, a valid epw file requires solar data (horizontal IR, direct normal radiation, and diffuse horizontal radiation).
While Boston has no dedicated data feed for solar data, we are fortunate to be located between two stations for the U.S. Climate Reference Network: Durham, NH and Kingston, RI. From their site: “The U.S. Climate Reference Network (USCRN) is a systematic and sustained network of climate monitoring stations with sites across the conterminous U.S., Alaska, and Hawaii. These stations use high-quality instruments to measure temperature, precipitation, wind speed, soil conditions, and more. The vision of the USCRN program is to provide a continuous series of climate observations for monitoring trends in the nation’s climate and supporting climate-impact research.”
Each station provides hourly global horizontal radiation.
Let’s finish the epw file containing actual data (2009, in this case)
From the Auxiliary Programs documentation for the EnergyPlus Weather File (EPW) Data Dictionary, if Horizontal Infrared Radiation Intensity is missing, it is calculated from the Opaque Sky Cover field. So, let’s derive direct normal and diffuse horizontal from the Durham NH CRN data. The 1981 BIRD model produces estimates of clear sky direct beam (normal), direct horizontal, global horizontal, and diffuse horizontal for a given lat/long. Dividing the actual hourly Durham global horizontal by the BIRD global horizontal, one can derive an hourly scaling value. Applying the hourly scaling value to the BIRD direct normal and diffuse horizontal yields approximate values to insert into the epw which was populated (above) with hourly ISD meteorological data.
Then, using the EP Weather Converter, this modified csv file can be converted to a time-specific epw file to use with idf files (with autosizing turned off).
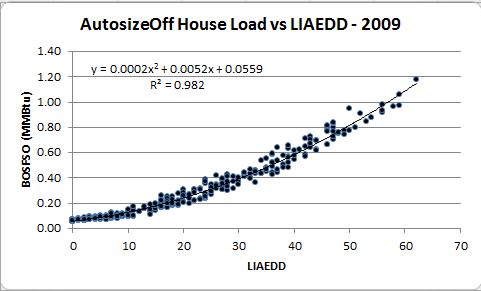
Daily house gas requirements vs. Actual EDD
Hourly gas usage is summed to the gas day. Daily EDDs are the mean of the hourly EDD values for Boston/Logan (KBOS), rounded to zero decimal places. The load fits a degree-2 polynomial nicely. The coefficients have waried a bit from the TMY HDD analysis. To be explored later…